New York City Taxi-Trip Duration

In this competition [link], Kaggle is challenging you to build a model that predicts the total ride duration of taxi trips in New York City. Your primary dataset is one released by the NYC Taxi and Limousine Commission, which includes pickup time, geo-coordinates, number of passengers, and several other variables.
The competition dataset is based on the 2016 NYC Yellow Cab trip record data made available in Big Query on Google Cloud Platform. The data was sampled and cleaned for the purposes of this playground competition. Based on individual trip attributes, participants should predict the duration of each trip in the test set.
File descriptions:
In this case I use a single notebook loadable from google colab.[link]
In the first instance, a simple EDA is carried out with the base features of the problem, where it is observed that there are no Nan elements in the database, that this database has features such as pickup and dropoff time(presented as datetime) as well as the respective coordinates of the trip (each presented as a float). Other types of data like objects or integers its found in the rest of the features such as passenger_count, store_and_fwd_flag, vendor_id. The target feature trip_duration was presented as an integer since it represents the time in seconds.
Feature Creation(Feature Engineering & Selection)
Distances
New features were created from existing ones, for example, the datetimes were broken down to the unit of minutes, as well as the coordinates of the trip were used to calculate 2 types of distances Haversine Distance and Dummy Distance.
- Haversine Distance
-
Euclidean Distance works for the flat surface like a Cartesian plain however, Earth is not flat. So we have to use a special type of formula known as Haversine Distance. Haversine Distance can be defined as the angular distance between two locations on the Earth's surface.
- Dummy Distance
-
The distance calculated from Haversine Distance made up of the perpendicular paths between the two points in question (Let P1(lat1, lng1) and P2(lat2, lng2) then dummy.distance = haversine.distance(lat1, lng1, lat1, lng2)+haversine.distance(lat1, lng1, lat2, lng1)).
These new features gave the possibility of calculating the average speed of each trip as well as its breakdown by hours, day of the week, etc.

Direction
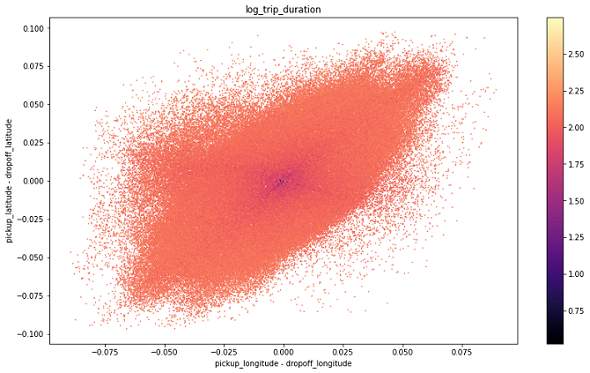
Another important feature created in this section will be the direction of the trip, this importance could be seen graphically by representing the differences between latitudes and longitudes:

Clustering
Besides of keeping entire list of latitude and longitute, the data will be grouped by some approximate locations. It might be helpful for tree-based algorithms. New features were created from clustering such as pickup_cluster and dropoff_cluster.
Additional Datasets
OSMR features
We had only rough distance estimates in the previous versions. We will now use additional data extracted from OpenStreetMap which was used successfully in the top scores. Most of the high scores use [Data about Fastest Routes]. Travel distance should be more relevent here. The difficult part is to adquire this feature. Thanks to Oscarleo who manage to pull it off from OSRM.
New features were added to our model from this database, such as total_distance, total_travel_time and number_of_steps.
Weather features
This dataset([KNYC Metars 2016]) is ment to be used as a extra information for those willing to extract conclusions from their own dataset where hourly weather information could be useful for their predictions / analysis. This is the METARs aggregated information for 2016 in KNYC. In this case where added minimum temperature, precipitation, snow fall and snow depth to our model.
Model Training(Hyperparameter Tuning)
Several algorithms can be used in this case I prefer a tree-based algorithm XGBRegressor. As we know optimizing the hyperparameters for machine learning models is vital to the performance of the machine learning models and the process of tuning the HPs is not intuitive and can be a complex task. In this case its use Randomized Search for a shorter run-time although may not return the best combination of hyper-parameters that would return the best score(neg_mean_squared_error), this method doesn't consider past evaluations and it will continue the iterations regardless of the results. In the end, for the chosen model, it was obtained:
method XGBModel.get_xgb_params of XGBRegressor(booster='gblinear', colsample_bytree=0.6, eta=0.04,
eval_metric='rmse', gamma=2, lambda=2, max_depth=10,
min_child_weight=5, n_estimators=500, nthread=-1, predictor='u',
random_state=42, silent=1, subsample=0.75)
